A Tech Blog by David Kandie

Tuesday, March 31, 2015

Optimization with Excel Solver Addin - An Overview

What are Solvers Good For?

Solvers, or optimizers, are software tools that help users find the best way to allocate scarce resources. The resources may be raw materials, machine time or people time, money, or anything else in limited supply. The "best" or optimal solution may mean maximizing profits, minimizing costs, or achieving the best possible quality.  An almost infinite variety of problems can be tackled this way, but here are some typical examples:

Finance and Investment

  • Working capital managementinvolves allocating cash to different purposes (accounts receivable, inventory, etc.) across multiple time periods, to maximize interest earnings.
  • Capital budgetinginvolves allocating funds to projects that initially consume cash but later generate cash, to maximize a firm's return on capital.
  • Portfolio optimization -- creating "efficient portfolios" -- involves allocating funds to stocks or bonds to maximize return for a given level of risk, or to minimize risk for a target rate of return.

Manufacturing

  • Job shop scheduling involves allocating time for work orders on different types of production equipment, to minimize delivery time or maximize equipment utilization.
  • Blending(of petroleum products, ores, animal feed, etc.) involves allocating and combining raw materials of different types and grades, to meet demand while minimizing costs.
  • Cutting stock(for lumber, paper, etc.) involves allocating space on large sheets or timbers to be cut into smaller pieces, to meet demand while minimizing waste.

Distribution and Networks


  • Routing(of goods, natural gas, electricity, digital data, etc.) involves allocating something to different paths through which it can move to various destinations, to minimize costs or maximize throughput.
  • Loading(of trucks, rail cars, etc.) involves allocating space in vehicles to items of different sizes so as to minimize wasted or unused space.
  • Schedulingof everything from workers to vehicles and meeting rooms involves allocating capacity to various tasks in order to meet demand while minimizing overall costs. 

Monday, March 30, 2015

The Ethics & Anti-Corruption Commission (EACC) Annual Report

The Ethics & Anti-Corruption Commission (EACC) Annual Report for the financial year 2013/2014. This Report is prepared pursuant to Section 27 of the Ethics and Anti-Corruption Act, 2011 http://www.eacc.go.ke/docs/annual%20report%202013-2014.pdf

Friday, January 23, 2015

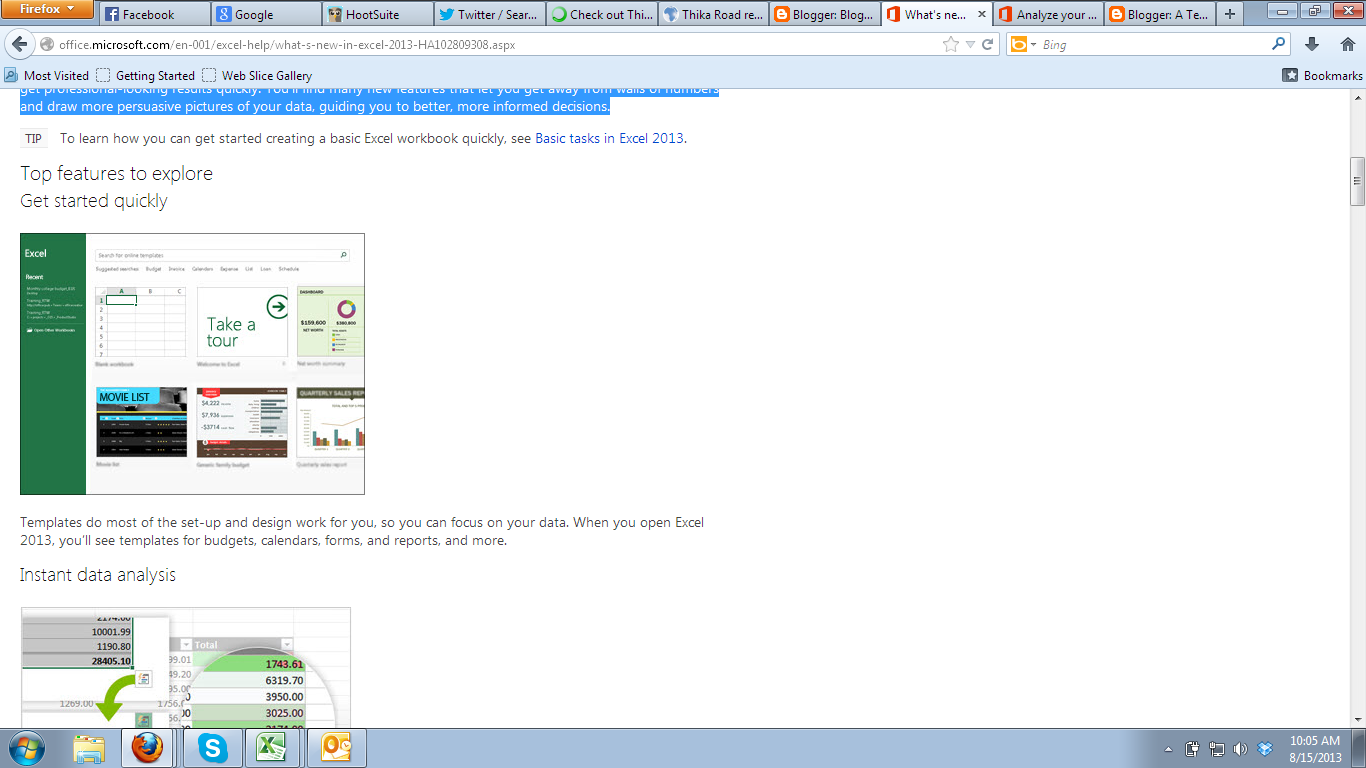
What's new in Excel 2013

The first thing you’ll see when you open Excel is a brand new look. It’s cleaner, but it’s also designed to help you get professional-looking results quickly. You’ll find many new features that let you get away from walls of numbers and draw more persuasive pictures of your data, guiding you to better, more informed decisions.

Welcome to GMAIL tabbed inbox from Google

Welcome to Gmail's tabbed inbox by Google. Highlights: Now you are able to group emails based on tabs (Promotions, Social, Primary, Forums and updates).

We are hiring! - Business Development Officer at OpenCastLabs Consulting

How to create user fum

Wednesday, October 23, 2013

Introducing PowerPivot for Excel 2010

What is PowerPivot
 
PowerPivot is a free add-in to the 2010 version of the spreadsheet application Microsoft Excel. In Excel 2013, PowerPivot is only available for certain versions of Office. It extends the capabilities of the PivotTable data summarisation and cross-tabulation feature with new features such as expanded data capacity, advanced calculations, ability to import data from multiple sources, and the ability to publish the workbooks as interactive web applications. As such, PowerPivot falls under Microsoft's Business Intelligence offering, complementing it with its self-service, in-memory capabilities.
Prior to the release of PowerPivot, Microsoft relied heavily on SQL Server Analysis Services as the engine for its Business Intelligence suite. PowerPivot complements the SQL Server core BI components under the vision of one Business Intelligence Semantic Model (BISM), which aims to integrate on-disk multidimensional analytics previously known as Unified Dimensional Model, or UDM, with a more flexible, in-memory "tabular" model.
As a self-service BI product, PowerPivot is intended to allow users with no specialised BI or analytics training to develop data models and calculations, sharing them either directly or through SharePoint document libraries.
As part of the July 8, 2013 announcement of the new "Power BI" suite of self-service tools, Microsoft renamed PowerPivot as "Power Pivot" in order to match the naming convention of other tools in the suite.

Microsoft PowerPivot for Microsoft Excel 2010 provides ground-breaking technology; fast manipulation of large data sets, streamlined integration of data, and the ability to effortlessly share your analysis through Microsoft SharePoint. 


How to download and install PowerPivot

Prerequisites:
  • Requires Microsoft Office 2010.
  • PowerPivot for Excel supports 32-bit or 64-bit machines.
  • PowerPivot requires a minimum of 1 GB of RAM (2 GB or more recommended).
Note: The amount of memory you need depends on the PowerPivot solution that you design.
  • Requires Windows XP with SP3, Windows Vista with SP1, or Windows 7
 Download PowerPivot Here

Important: If you are using the 32-bit version of Excel 2010, you must use the 32-bit version of PowerPivot. If you are using the 64-bit version of Excel 2010, you must use the 64-bit version of PowerPivot. The versions are not interchangeable. 

Install and configure PowerPivot for Excel 2010:
  1. Open the folder where you downloaded PowerPivot for Excel 2010.
  2. Double-click the PowerPivot_for_Excel.msi file, and then follow the steps in the wizard.
  3. After the installation is complete, click Finish.
  4. Click Start, click All Programs, click Microsoft Office 2010, and then click Microsoft Excel 2010.
  5. When Excel 2010 starts, a message appears asking if you want to install PowerPivot. Click OK.
  6. After installation completes, the PowerPivot tab appears in the Office 2010 ribbon.
In my next post we will see..oh my, you can analyze multiple data tables from Oracle, SQL, Excel, Text, Access and Much more!

Let's go.